
at 14:39 UTC on Sep 8, people started opening one page of our dashboard
a minute later our analytics database was at 67 GiB of memory, against a ceiling of about 65
it didn't fall over at once. the database lets memory run past that line for a moment before it starts shooting, so the kills only began at 14:42. at 14:44 it peaked at 70.3 GiB. at least 35 queries died. by 14:48 it was back at 29 GiB, like nothing happened. it spent about seven minutes above the ceiling, from 14:40 to 14:47
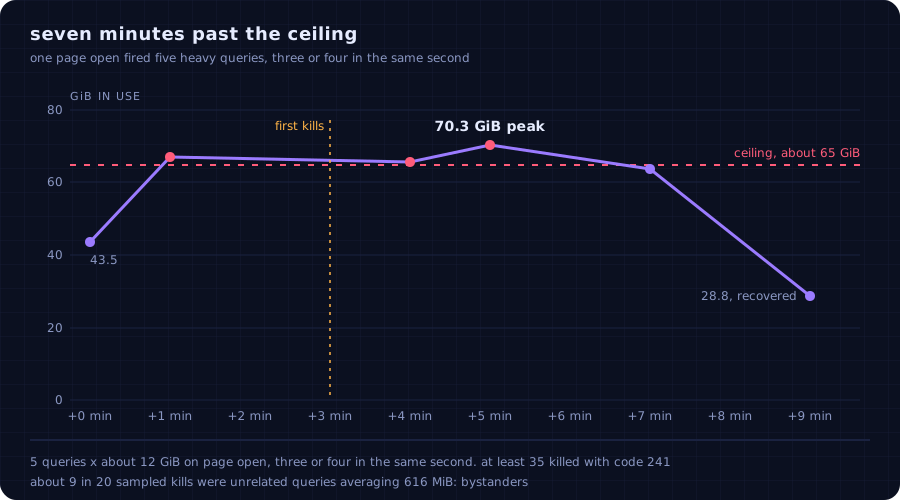
the weird part is who died. in a sample of 20 kills, 9 were queries that had nothing to do with that page. they averaged 616 MiB each. innocent bystanders, shot because somebody else was greedy
this is the story of how my team learned to read that chart. it took three months, a few wrong turns and one EXPLAIN we should have run on day one
the slow burn
it started on Aug 3. a release turned on a few new analytics features and traffic moved up a step
after that it happened every day, mostly between 11:00 and 13:00 UTC. some dashboards took more than ten minutes. our backend retried the queries that got killed, which put them back into a database that was already full. a retry storm on top of an out of memory problem is a very efficient way to stay out of memory
two things showed up in the first look. a few app queries read about 199M rows per call with no account filter. and the pre-computed tables that ClickHouse rebuilds on a schedule were colliding: one of them kept failing, over and over, each time trying to grab a 28 GiB chunk and dying
so the first theory was easy. too many heavy refreshes, too much overlap, fix the refreshes
theory one: it's the refreshes
the heaviest rebuilds ran about 900 minutes a day between them, and most of that sat in an afternoon window where the cluster logged 21 to 102 kills a day
so we replaced some of them with direct queries. then we did the thing I'm proudest of in this whole story, which is that we measured the endpoints end to end instead of trusting per-query numbers
three of six replacements lost. one query that took 0.4 seconds alone pushed its endpoint from 6.7 s to 26 s, because the endpoint called it six times. we reverted those three and kept the rest. the kills did not stop
then settings. we tried fewer threads: 2.00 GiB became 1.96. we tried spilling to disk: 1.98. one join setting did halve it to 1.03 GiB, and made the query 3.7 times slower, 2 s to 7.5 s
a memory cap of 800 MB just killed the query in 0.27 s. that one taught me something though: a per-query cap is a circuit breaker, not an optimiser. it makes failures small. it doesn't make queries small
the turn
then came Sep 8, the seven minutes at the top. now we had a clean crime scene: five queries, about 12 GiB each, fired together because the page drew five charts the moment it opened. three or four of them started in the same second
so we finally ran EXPLAIN indexes=1 on one of them
it had two scans of the same table next to each other. one said Condition: true and read 10,310 of 10,310 granules. a full scan. the other was pruned correctly, 70 of 10,310
the filters for the joined table were sitting in the ON clause of a LEFT JOIN. on our version, ClickHouse applied them during the join, after it had already read the whole table, so the index never saw them. worse, the date filter wrapped the column in toDate(), on a column that was already a date. it did nothing for the result, and here it stopped the index from pruning on that column, even in a WHERE. so the fix was two moves: filter that table in a subquery first, then join, and put the function on the literal instead of the column
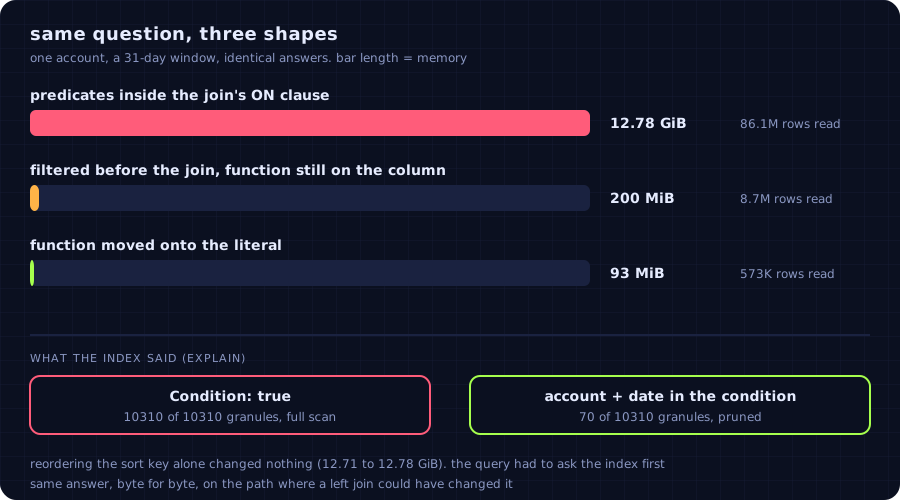
86M rows and 12.78 GiB became 8.7M rows and 200 MiB, then 573K rows and 93 MiB. same answer, byte for byte, including the rows where a left join could have lied to us
that last part is not free. filtering the joined table before the join is safe in principle, because a row you filter out still fails to match. moving the same filter to the outer WHERE is a different query and drops rows. we diffed the output on three windows before trusting it, and you should too
a sort key reorder we had already applied changed nothing on its own (12.71 to 12.78 GiB). it only paid off once the query asked the index a question
we'd spent weeks tuning how the database copes with a query that should never have been that big. the fix for that page was in review the next day
the alarm that stayed quiet
there was one more puzzle. why did the queries-per-second chart look calm during the seven minutes?
because memory isn't request rate. it's how many heavy queries are alive at once, times their bytes. the average for the spike minute looked mild: 8.3 queries per second, each living 773 ms and using 484 MiB, about 6.4 in flight. that's only about 3 GiB. the damage came from the peaks: up to 35 queries in flight, and three or four 12 GiB queries starting in the same second, about 40 GiB at once. at midnight, 73.9 queries per second, 39 ms and 70 MiB each
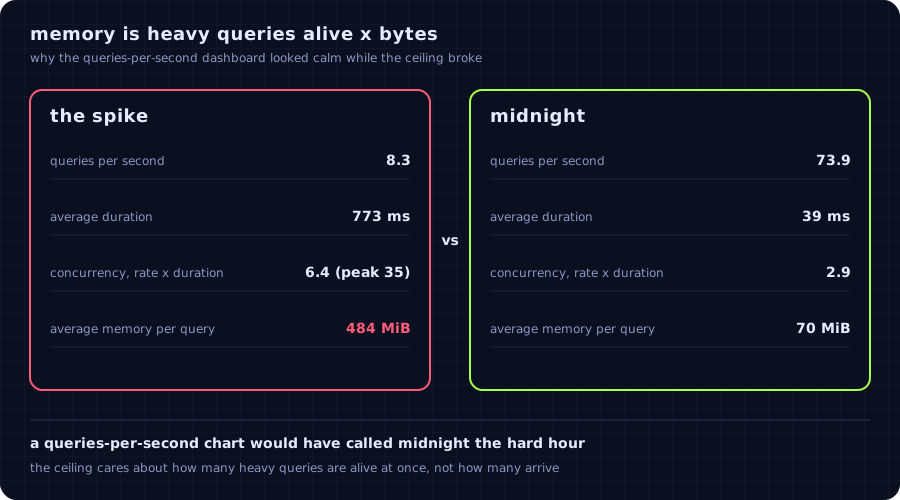
a queries-per-second chart would have called midnight the hard hour. the ceiling disagreed
it came back, in three costumes
I'd love to end here. we didn't get to
in late October, bursts hit on two Mondays: about 20 thousand failed queries in eleven days, the second burst 2.4 times the first, and about 90 accounts hit in a single day. a permission lookup that scanned all 99M rows of a table was one cause, but it was only in about 20% of the failed queries. the rest was probably general pressure, though we never checked the query log to prove it
on Nov 6 a search feature ran 14 to 18 GiB per query. we had just added a 24 GiB per-query cap. twelve of them ran in five minutes, three or four at once fill a replica, and five dashboard requests from three customers failed for about three minutes. the cap did nothing, because no single query broke it
on Nov 12, the same shape as Sep 8, wearing different clothes. one analytics page, loaded about 58 times in two minutes, each load joining a whole 9M-row table with no account filter. 48 queries killed. the fix was the same idea, filter before you join: the heaviest query went from 1.96 GiB to 143.7 MiB, and from 1,683 ms to 144 ms. yes, two 144s, I checked twice. this time a unit test fails if anyone joins that table without the filter again
what I'd tell past me
fix the shape of the query before you tune the database. every setting we tried either did nothing or paid for it in latency. one EXPLAIN took a test query from 12.78 GiB to 93 MiB
a cap makes a failure small, it doesn't make the query small. you need both, and you need the cap to sit below the point where several queries together are enough. a per-query cap can't see that. a per-user memory cap (max_memory_usage_for_user) or a concurrency limit (max_concurrent_queries_for_user) can
watch concurrency and memory, not request rate. we now alert when a replica passes 85% of its limit, plus a monitor that checks every five minutes for queries killed with code 241
and let the failure be polite. the database's error code leaks out as the HTTP status, and the dashboard page crashed on it. we have a change in review that stops retrying a refused query and answers a clean 503 when the cluster is busy. until it merges, none of that is live
is it solved? not forever. the last fix merged two days ago, and merged is not the same as proven. I won't call a pattern gone because it went quiet for a weekend
but the first time I read that chart it was a mystery. now it's just arithmetic, and arithmetic you can do something about =)
Written by J., reviewed and refined by Kai.